Weekly Analysis 1
Weekly analysis 1.
I’m sorry, I didn’t get a chance to finish this page. Doing all this is time consuming. - 09/17/2024 ~Seth
I will be analyzing my habits, health and sharing various metrics.
To start off, let’s analyze my daily strain. This will help us identify potential anomalies and give us a better understanding of other metrics.
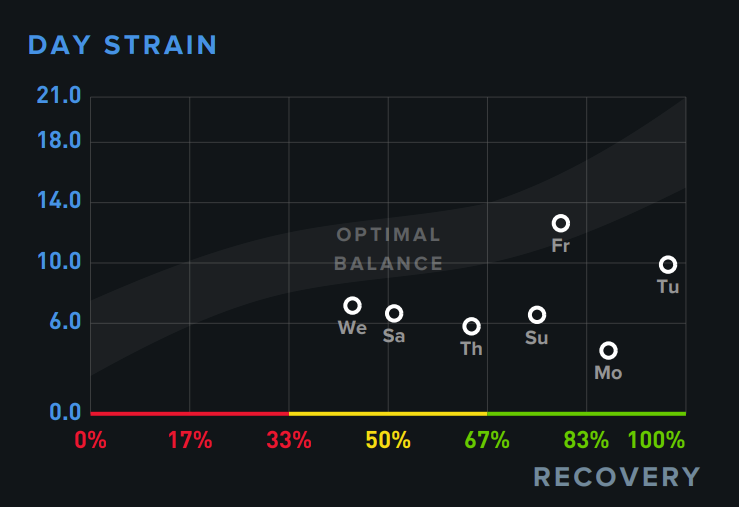
On the graph, we can see the day strain vs recovery.
What is interesting, Wednesday and Saturday, which have ~50%, with Wednesday being a few percentages lower on the recovery scale - have..
Let’s analyze the strain first.
Strain
Strain measures the cardiovascular and muscular load on the body throughout the day
Strain Values
Light (0-9) - Minimal stress put on the body, room for active recovery
Moderate (10-13) - Moderate stres on the body, generally good for maintaining fitness
High (14-17) - Increased stress and activity level, ideal for making fitness gains when training
All out (18-21) - Significant stress, often overreaching, likely very difficult to recover from the next day
Calculating Strain
Strain is calculated on a logarithmic scale, measured from:
- Heart Rate
- Duration & Intensity
First, let’s import the data into a table, creating rows 1-7 referencing the days of the week, staring with sunday.
| Strain (max 21) |
|---|
| 4.3 |
| 4.2 |
| 9.9 |
| 7.2 |
| 5.8 |
| 12.6 |
| 6.7 |
Creating an initial histogram of n=7
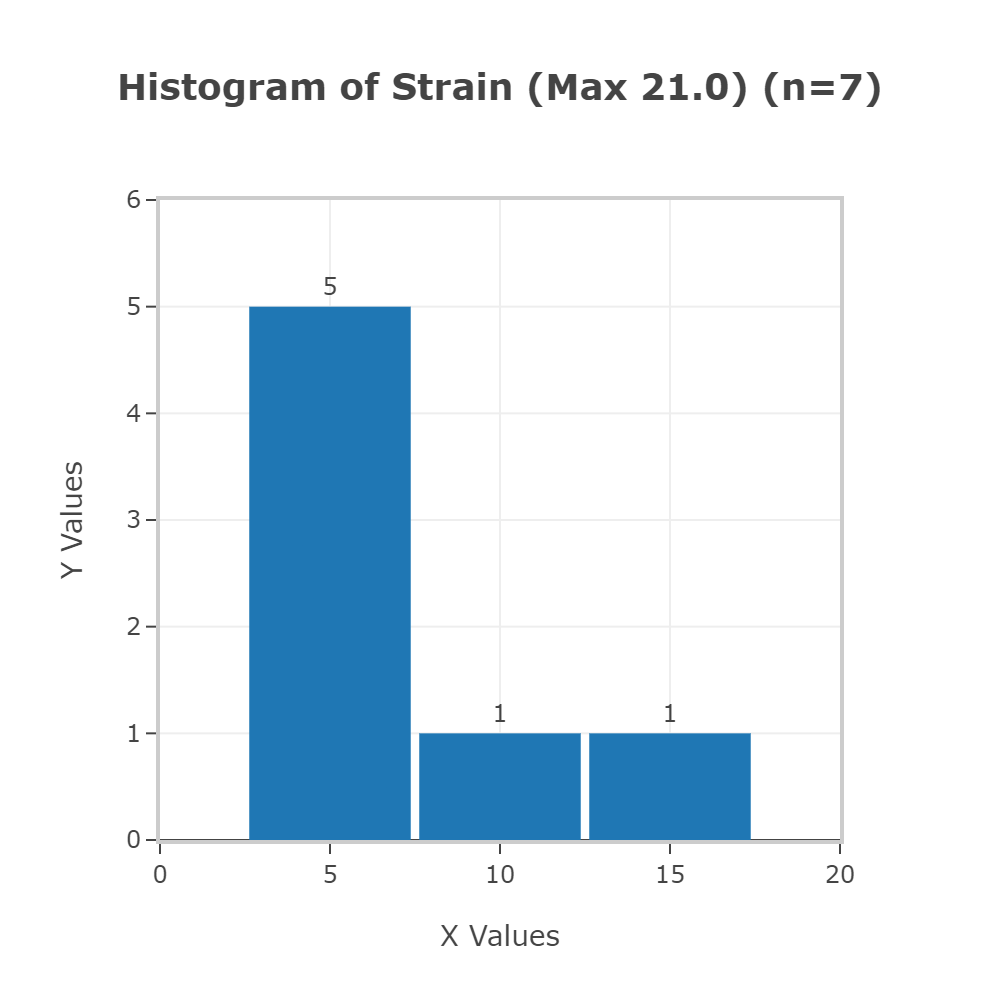
This doesn’t really give us the full picture, and is quite difficult to understand. We are just clustering here.
Instead, we can see the range within a boxplot:
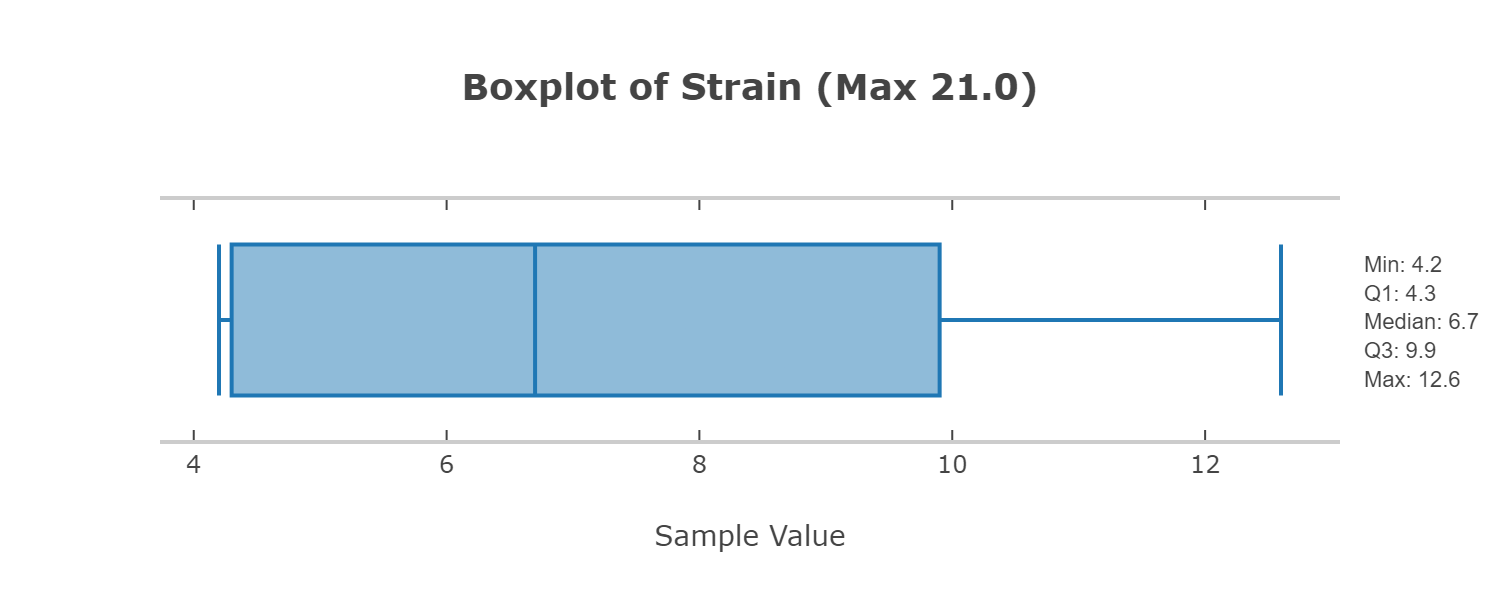
We can see some valuable information such as:
Min: 4.2 Q1: 4.3 Median: 6.7 Q3: 9.9 Max 12.6
This lets us get a visual of the range. Theoretically the maximum amount of strain is 21.
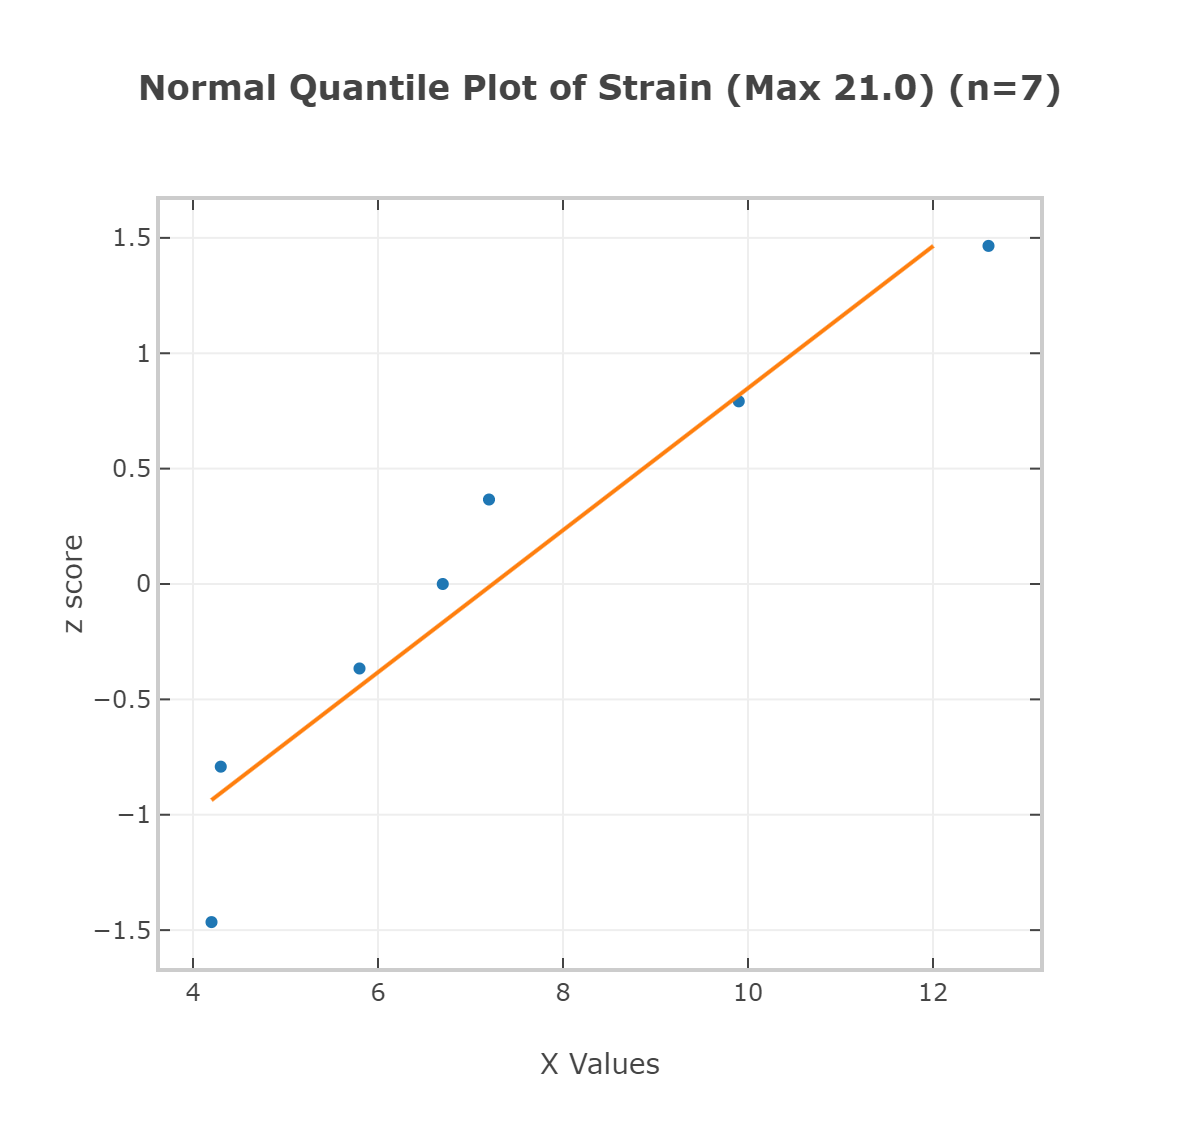
Again, we can visualize this data:
Now, we can add some other values into the mix. Recovery is on a scale of 100%.
Following the recovery scores, on the same rows of 1-7,
| Recovery Max (100%) |
|---|
| 6 |
| 87 |
| 97 |
| 44 |
| 64 |
| 79 |
| 51 |